Webinar: Improve Your Processes with Insights from Data Visualization
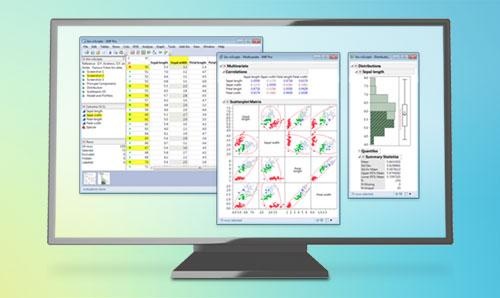

Data in industry is coming in larger quantities, more frequently and from more sources all the time. The buzzwords Internet of Things, Big Data and Industry 4.0 were coined to describe the benefits companies can realise by using this opportunity to gain a competitive edge. But managers, engineers and scientists tell us that they are unable to get to more useful insights from data, or that they are uncertain how to set up future activities or strategies, because they don't have the skills, experience or tools to do so.
It all requires the use of statistics, and that is often associated with reluctance and prejudice. But applying statistics today is an easy, almost playful task.
Find out in this free webinar on November 30, 11:00-12:00 (CET), how modelling and machine learning can be used to understand complex patterns and relationships in your data. And how you can easily build interactive visual dashboards for compelling communication to ensure stakeholder buy-in.
The instructor Bernd Heinen is a systems engineer for JMP, a business unit of SAS. Subsequent to the webinar he will available to answer your questions.


most read
20 Years of CHEManager International
Incredible but true: CHEManager International is celebrating its 20th anniversary!

Pharma 4.0—the Key Enabler for Successful Digital Transformation in Pharma
Part 3: Seven Theses for successful Digitalization in Pharma

Relocation of Chemicals Production Footprint in Full Swing
A new Horváth study based on interviews with CxOs of Europe’s top chemical corporations reveals: The majority of board members expects no or only weak growth for the current year.

Pharma 4.0 – the Key Enabler for Successful Digital Transformation in Pharma
Part 1: Building a Business Case for Pharma 4.0
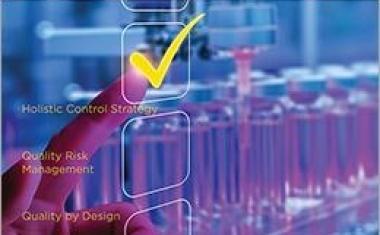
ISPE Good Practice Guide: Validation 4.0
The Validation 4.0 Guide provides a comprehensive approach to ensuring product quality and patient safety throughout a pharmaceutical product's lifecycle.